Products
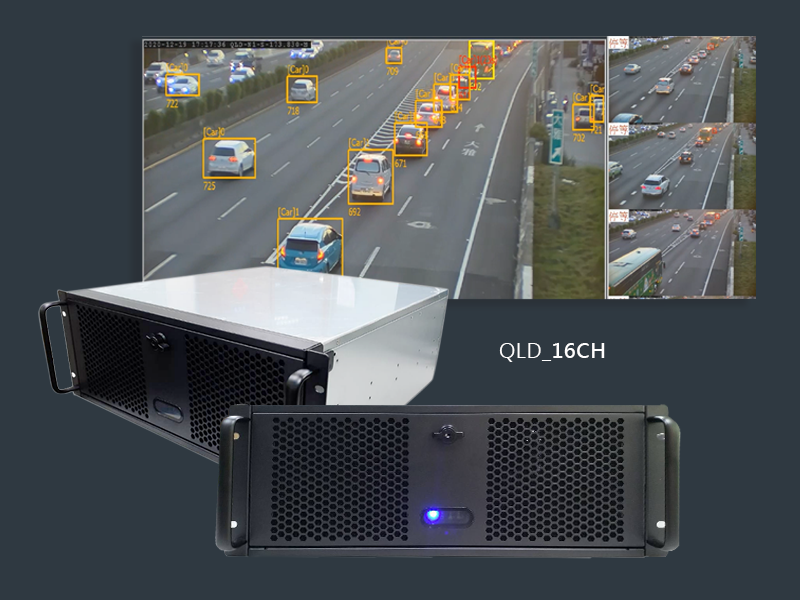
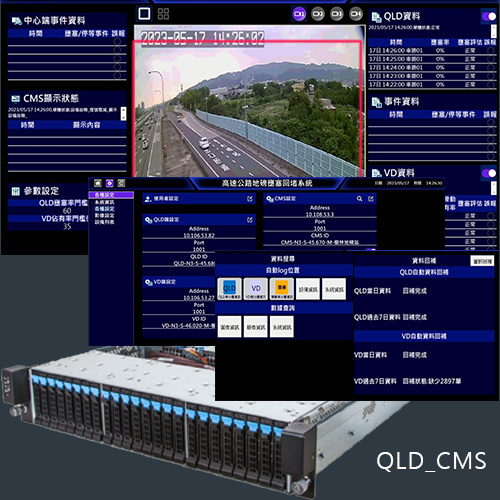
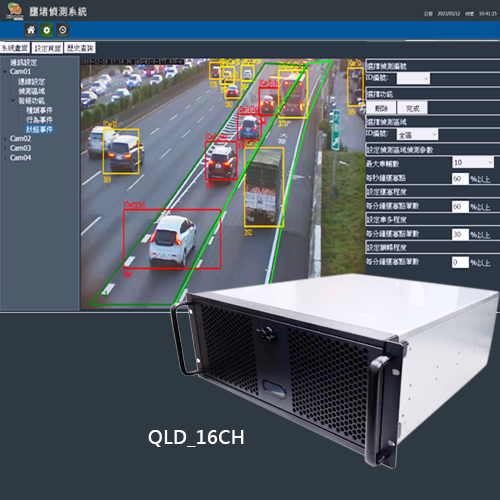
QLD_16CH Queue Level Detection Analysis Server
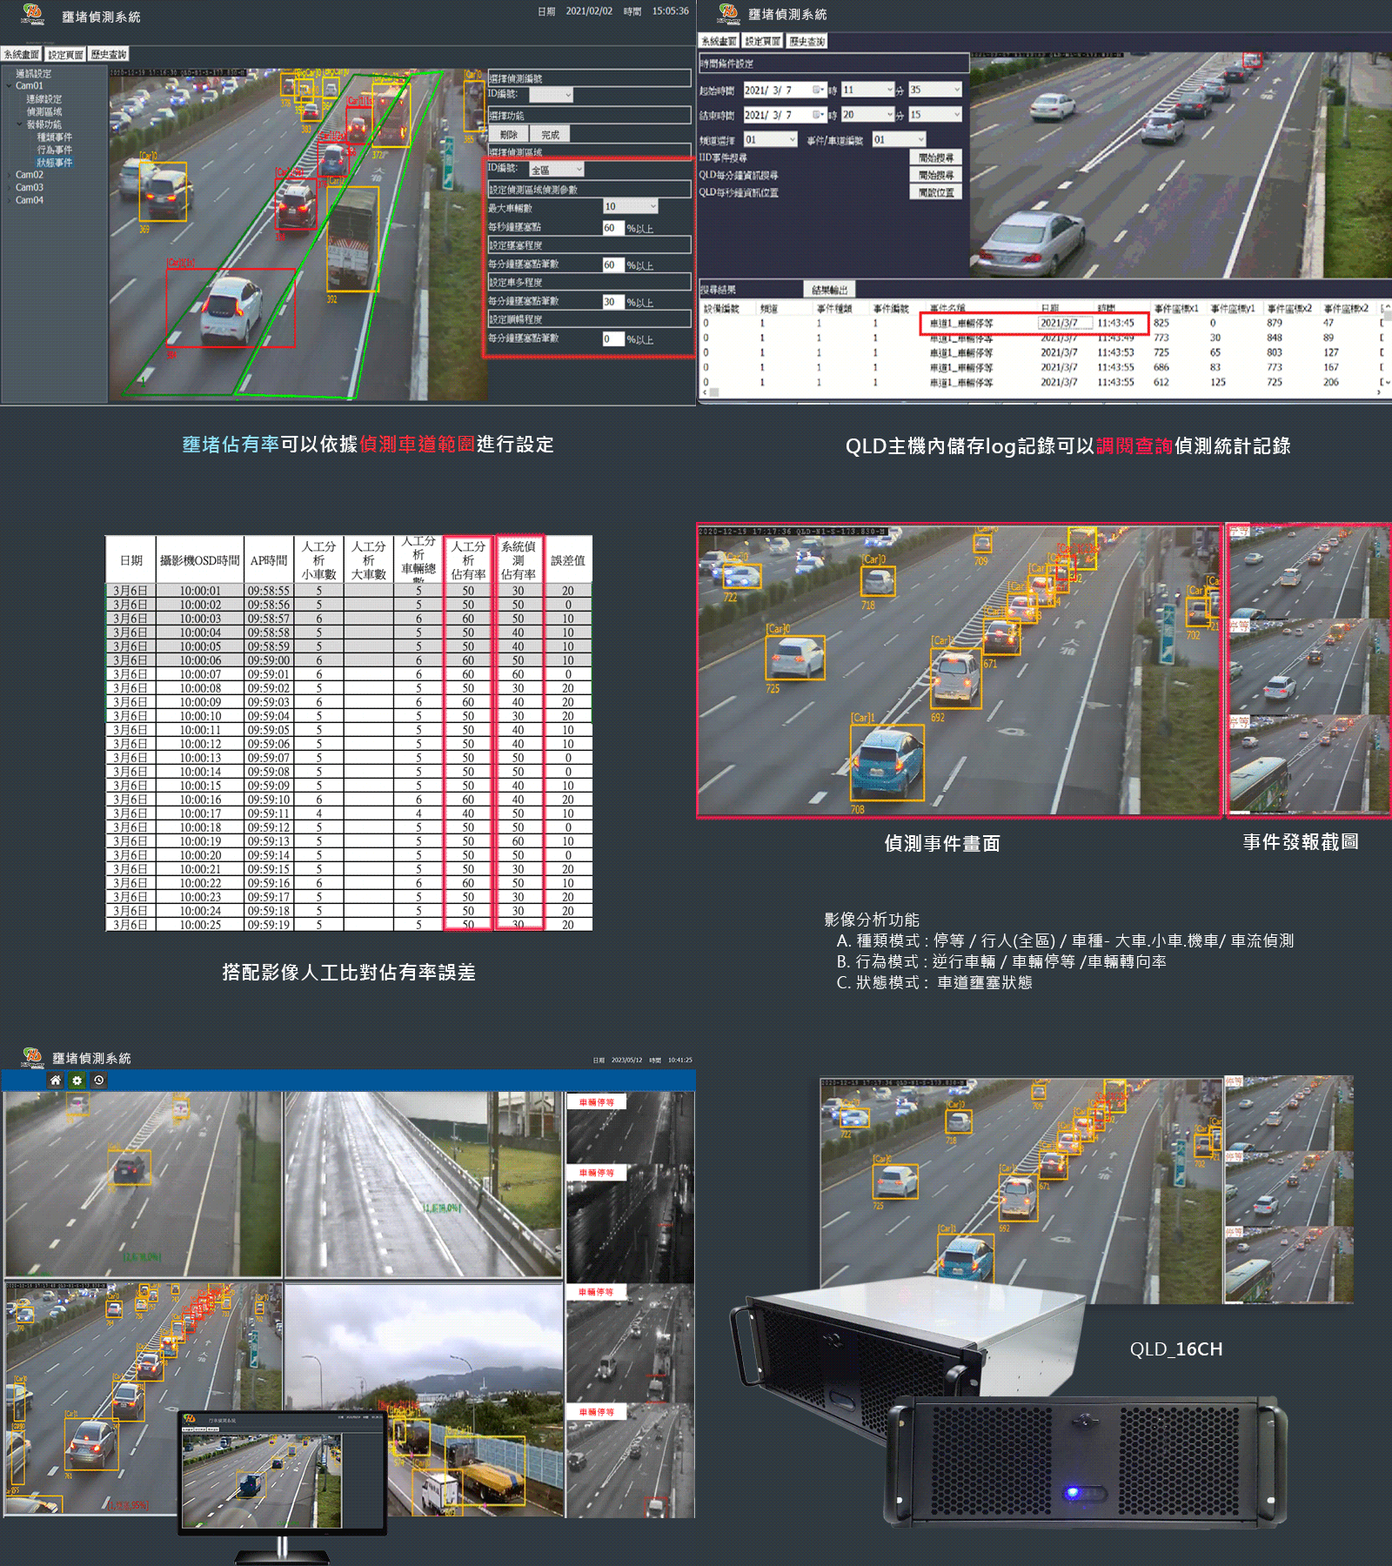
Queue Level Detection(QLD)
1- Advanced image recognition and analysis technology utilizing deep learning.
2- VDs Image Analysis Features.
B. Behavior Mode : Opposing Vehicles / Vehicle Waiting / Vehicle Turn Rate
C. Status Mode : Lane Congestion Status
Congestion and Backlog System Functions
Capable of displaying real-time images (H.264 format, resolution of 1280X720 or higher, at least 15 frames per second).Real-time images should display the detection area along with its status.
Provides a minimum of 1 real-time spatial density data point per second. (Spatial Density (%) = Area Occupied by Vehicles / Area of Detection Zone)
Can instantly provide information on vehicle waiting events within the detection area and report them to the central computer.
Allows the configuration of a single spatial density data point as a congestion condition, with the congestion value being customizable.
Reports congestion rate to the central computer every minute. (Congestion Rate (%) = Number of Records Classified as Congested per Minute / Number of Spatial Density Records per Minute)
Can adapt to detect both straight and curved detection zones according to the on-site environment.
Data Reporting (Each configuration report can operate independently at the same time)
Prioritizes data reporting into Event Detection Reporting, Instantaneous Speed Reporting, and Periodic Reporting.Spatial density (%) within the detection area is reported according to the transmission cycle, with a period of 1 minute.
Event detection reporting cycle can be customized, with a default time of 20 seconds. It can also provide an immediate report of the current cycle data upon request.
Each detection configuration should be able to operate independently and simultaneously, unaffected by other query reporting commands.
Trigger Configuration Reporting Method
When the area occupied by a vehicle exceeds the set value, it will automatically initiate an area occupation event report. The set value can be adjusted from 1 to 254 seconds, in one-second increments.In the event of a communication disconnection, data can be stored at the front end.
Upon communication restoration, the disconnected data can be sent back to the central end based on query commands.
Other Features
Capable of simultaneously detecting one-way and two-way traffic on eight (or more) lanes.Adopts the "Highway Traffic Control Standard Communication Protocol Version 3.0". For unsupported functions, the field value can be set as "FF".
Accuracy
Vehicle Type Flow:Accuracy within ±20% for small and large vehicles. Vehicles traveling at speeds below 30 kilometers per hour are not included in the accuracy calculation.Lane-specific Flow:Total traffic flow accuracy within ±20%.
Average Vehicle Speed:Average Vehicle Speed: Accuracy within ±20% for speeds between 30 and 120 kilometers per hour.
Accuracy of Spatial Density is 85% or higher.。
Accuracy(%) = (Number of Spatial Density Records per Minute - Number of Records with Spatial Density Errors exceeding ±20%) / Number of Spatial Density Records per Minute
Data Collection
Congestion rate (%) within the detection area.Vehicle waiting detection within the detection area.
On-Site Operation Mode
Equipped with all functions for remote operation and inquiries.Device reports will simultaneously be sent to both the remote end and the handheld testing device.
After on-site operations conclude, an automatic report will be sent to the central end.
The central end can release control over the on-site operations at any time.
Data that the terminal controller needs to report based on queries from the remote end or handheld testing device only needs to be reported back to the original querying source.
Remote Operation Mode
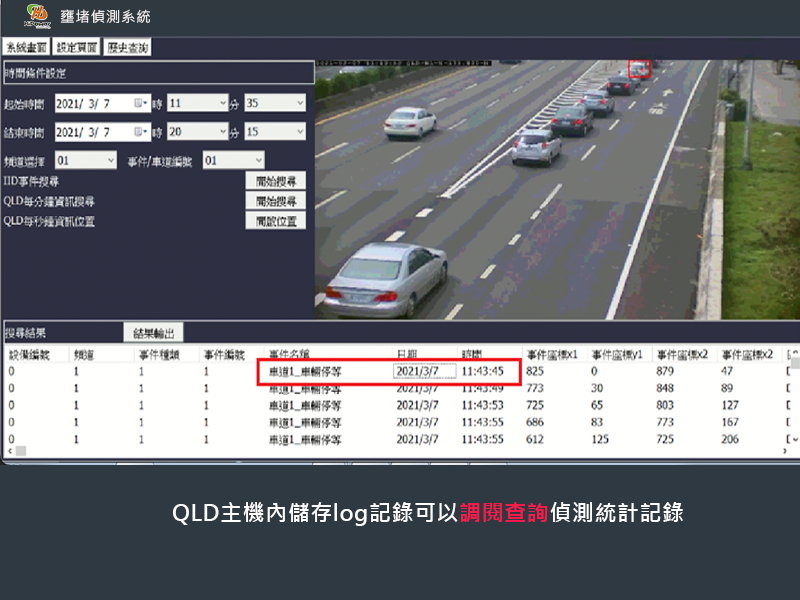
Can query and report hardware and communication status based on commands.Can set the year, month, day, hour, minute, and second data, inquire about the time on the front-end device, and report the on-site time along with any deviation in seconds.
Can query and report the device number, firmware version, and version date of the front-end device based on commands.
Can download and upload updates for on-site device software. After a restart, the updated software will be executed.
Hardware Abnormal Recovery
Remote communication reset can be performed.Remote hardware reset can be conducted, and memory data will not be cleared during the reset. (Data includes stored data, configurations, and parameter settings)
After on-site power outage and restoration, the system will reboot, automatically initiate the initialization process, and resume normal operation.
Equipped with a Watch-Dog that can automatically initiate the initialization process. After completion, it will automatically report back to the central end. In the event of abnormal data, a request can be made to the central end to download relevant configuration data.
Data Storage and Protection
Each piece of data (including event images) can be stored at the front end for a period of 7 days or more.In the event of a communication disconnection, data can be stored at the front end.
Upon communication restoration, disconnected data can be sent back to the central end based on query commands.
| Operating System | Central Processing Unit | Memory | Network | Graphics Card | Screen Output | Hard Drive | Watchdog | Others | Place of Manufacture |
|---|---|---|---|---|---|---|---|---|---|
| Windows 10 Pro Chinese Version 64-bit or higher. | 2.4GHz or above. | 64G RAM | - RJ-45, 2x 100/1000Base TX Ethernet network interfaces (no other interface conversions). - Complies with IEEE802.3/Ethernet 100Base-TX and IEEE802.3/Ethernet 1000Base-T standard specifications, with bandwidth of 100/1000Mbps, capable of automatic switching. - Each set of network interfaces can be configured with a different IP Address. |
Independent graphics card with memory of 10GB or above. | One each of VGA and HDMI outputs. | Supports installation of up to 8 drives at 7200RPM, with a maximum capacity of 64TB. | Built-in hardware and software watchdog timer for monitoring. Operates independently (not the same unit as the central processing unit), capable of detecting CPU power abnormalities, software and firmware program anomalies, and resetting the system. |
- Equipped with power switch and reset button. - Display function, equipped with power and system operation |
Made in Taiwan. |
-
Catalog Download on May, 2023
Queue Level Detection(QLD)
Application Actual Cases
Highway Events
Highway Events
Highway Events
Highway Events
Highway Events
Highway Events
HiPower provides professional AIOT comprehensive solutions.
We integrate image detection and analysis technology, optical sensing signals, and IO control linkage design.
We also employ various technologies such as WEB cloud platform communication specifications and user interface integration components.
Based on the specific requirements of different industries, we offer customized decision-maker analysis management systems to our clients. Additionally, we provide application solutions for various industries.
Our goal is to combine cloud application system platforms to deliver advanced decision-maker analysis management systems that meet the needs of our customers
